Klinger Volume Oscillator (KVO) Backtest The Klinger Oscillator (KO) was developed by Stephen J. Klinger. Learning
from prior research on volume by such well-known technicians as Joseph Granville,
Larry Williams, and Marc Chaikin, Mr. Klinger set out to develop a volume-based
indicator to help in both short- and long-term analysis.
The KO was developed with two seemingly opposite goals in mind: to be sensitive
enough to signal short-term tops and bottoms, yet accurate enough to reflect the
long-term flow of money into and out of a security.
The KO is based on the following tenets:
Price range (i.e. High - Low) is a measure of movement and volume is the force behind
the movement. The sum of High + Low + Close defines a trend. Accumulation occurs when
today's sum is greater than the previous day's. Conversely, distribution occurs when
today's sum is less than the previous day's. When the sums are equal, the existing trend
is maintained.
Volume produces continuous intra-day changes in price reflecting buying and selling pressure.
The KO quantifies the difference between the number of shares being accumulated and distributed
each day as "volume force". A strong, rising volume force should accompany an uptrend and then
gradually contract over time during the latter stages of the uptrend and the early stages of
the following downtrend. This should be followed by a rising volume force reflecting some
accumulation before a bottom develops.
You can change long to short in the Input Settings
Please, use it only for learning or paper trading.
在腳本中搜尋"high low"

B3 Edge Trail-TraderAnswer to the locked strategy... Formerly "High-Low Trader" .. Changed the name to Edge Trail Trader to delineate from the locked version, which is no different. You can add this one to your favorites now.
Similar to SuperTrend or the ATR trailing stop lines that are common-place in chart indicator circles, the B3 High-Low Trail-Trader works as a back-break line to flip binary long and short biasing. Here is the strategy set to 7 bars back. You can find this style of trading system in several books, and there are many ways to come to the trailing stop line, so I imagine the bars back length can be slid around to suit certain charts. This happens to be my favorite trailing line.

HullMA cross StrategyFrom Indicator420 by SeaSide420 HULL MOVING AVERAGE CROSS & CANDLE CROSS
Hull Moving Average (HMA) formula
Integer(SquareRoot(Period)) WMA (2 x Integer(Period/2) WMA(Price) - Period WMA(Price))
Solving the problem of lag requires an explanation with numbers rather than charts. Consider a series of 10 numbers from '0' to '9' inclusive and imagine that they are successive price points on a chart with 9 being the most recent price point at the right hand leading edge.
If we take the 10 period simple average of these numbers then, not surprisingly, we will determine the midpoint of 4.5 which significantly lags behind the most recent price point of 9. Here's the clever bit, first let's halve the period of the average to 5 and apply it to the most recent numbers of 5, 6, 7, 8 and 9, the result being the midpoint of 7.
To remove the lag we take the midpoint of 7 and add the difference between the two averages which equals 2.5 (7 - 4.5). This gives a final answer of 9.5 (7 + 2.5) which is a slight overcompensation. But this overcompensation is very handy because it offsets the lagging effect of the nested averaging.
Hence the result of combining these 2 techniques is a near perfect balance between lag reduction and curve smoothing. The HMA manages to keep up with rapid changes in price activity whilst having superior smoothing over an SMA of the same period.
The HMA employs weighted moving averages and dampens the smoothing effect (and resulting lag) by using the square root of the period instead of the actual period itself.
There are 3 HullMAs in the script, one runs on current price, and others on previous candle prices, when they cross over, is the entry signal.
The strategy also includes a candle cross condition for entry:
(if current price greater than previous candle value (Open+High+Low+Close)/4) then BUY
(if current price less than previous candle value (Open+High+Low+Close)/4) then SELL
in total 4 crossover conditions must be met to initiate a signal.

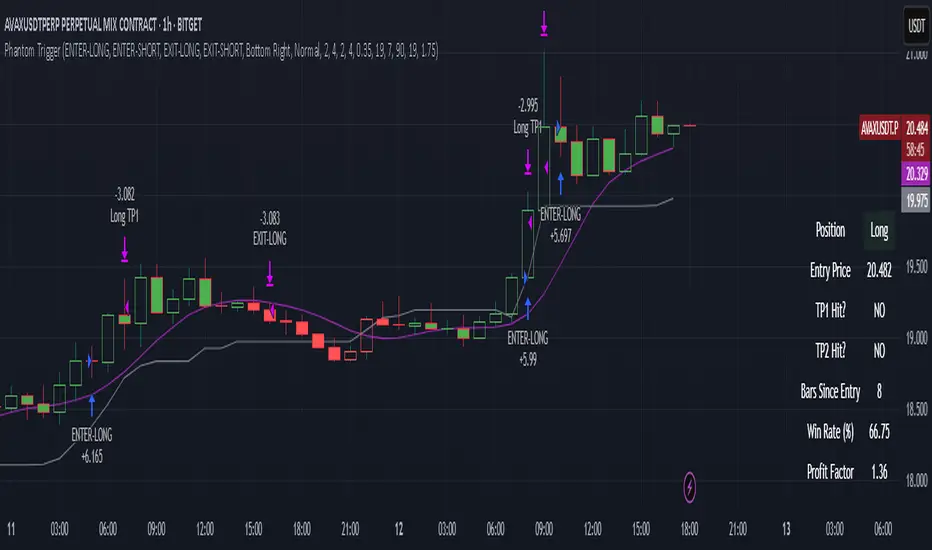
Phantom Trigger Phantom Trigger – Precision Trend Execution with TP1/TP2 and Weak Trend Exits
Phantom Trigger is a professional-grade trend-following strategy designed for crypto and high-volatility assets. It combines advanced trend detection with precise risk-managed exits using a multi-level take-profit system.
🔍 What It Does
Identifies strong directional moves using a multi-stage smoothed trend model
Confirms entries using structure-based logic and volume pressure
Filters trades using bias zones, confirmation levels, and trend acceleration
Automatically manages trades with two-stage take-profits (TP1 and TP2)
Exits early on trend weakness before reversal
Includes a styled real-time dashboard and bar coloring for visual guidance
Sends bot-compatible alerts for multi-exchange automation
⚙️ Core Components
Trend Engine: A smoothed dynamic filter detects real-time trend direction and momentum shifts
Bias Structure: Mid-high/low range-based logic determines if price is favoring bullish or bearish structure
Confirmation Levels: Short- and long-term zone crossovers confirm directional alignment
Volume Filter: Detects volume expansion spikes to validate strong breakout potential
TP1/TP2 Logic: Dynamically sets two profit targets and executes partial and full exits automatically
Weak Trend Exit: Closes positions one bar before reversal using directional filters
🧠 How to Use
Works best on crypto (1H, 4H) and high-volume instruments
Use dashboard stats to monitor position status, PnL, and TP1/TP2 progression
Alerts are pre-labeled and compatible with bots like 3Commas, Wunderbit, etc.
Can be adapted for both scalping and swing trading
📊 Dashboard
The built-in real-time dashboard displays current trade status, entry price, TP1/TP2 progress, win rate, profit factor, and bars since entry. It updates live with every candle and provides a quick-glance overview to support your decision-making during active trades.
🧠 How to Use
Works best on crypto (1H, 4H) and high-volume instruments
Use dashboard stats to monitor position status, PnL, and TP1/TP2 progression
Alerts are pre-labeled and compatible with bots like 3Commas, Wunderbit, etc.
Can be adapted for both scalping and swing trading
⚠️ Disclaimer
This script is for educational purposes only and does not constitute financial advice. Always test strategies thoroughly using demo or backtesting environments before applying to live markets. Past performance is not indicative of future results.
VWAP StrategyVWAP and volatility filters for structured intraday trades.
How the Strategy Works
1. VWAP Anchored to Session
VWAP is calculated from the start of each trading day.
Standard deviations are used to create bands above/below the VWAP.
2. Entry Triggers: Al Brooks H1/H2 and L1/L2
H1/H2 (Long Entry): Opens below 2nd lower deviation, closes above it.
L1/L2 (Short Entry): Opens above 2nd upper deviation, closes below it.
3. Volatility Filter (ATR)
Skips trades when deviation bands are too tight (< 3 ATRs).
4. Stop Loss
Based on the signal bar’s high/low ± stop buffer.
Longs: signalBarLow - stopBuffer
Shorts: signalBarHigh + stopBuffer
5. Take Profit / Exit Target
Exit logic is customizable per side:
VWAP, Deviation Band, or None
6. Safety Exit
Exits early if X consecutive bars go against the trade.
Longs: X red bars
Shorts: X green bars
Explanation of Strategy Inputs
- Stop Buffer: Distance from signal bar for stop-loss.
- Long/Short Exit Rule: VWAP, Deviation Band, or None
- Long/Short Target Deviation: Standard deviation for target exit.
- Enable Safety Exit: Toggle emergency exit.
- Opposing Bars: Number of opposing candles before safety exit.
- Allow Long/Short Trades: Enable or disable entry side.
- Show VWAP/Entry Bands: Toggle visual aids.
- Highlight Low Vol Zones: Orange shading for low volatility skips.
Tuning Tips
- Stop buffer: Use 1–5 points.
- Target deviation: Start with VWAP. In strong trends use 2nd deviation and turn off the counter-trend entry.
- Safety exit: 3 bars recommended.
- Disable short/long side to focus on one type of reversal.
Backtest Setup Suggestions
- initial_capital = 2000
- default_qty_value = 1 (fixed contracts or percent-of-equity)

Strategy Myth-Busting #11 - TrendMagic+SqzMom+CDV - [MYN]This is part of a new series we are calling "Strategy Myth-Busting" where we take open public manual trading strategies and automate them. The goal is to not only validate the authenticity of the claims but to provide an automated version for traders who wish to trade autonomously.
Our 11th one is an automated version of the "Magic Trading Strategy : Most Profitable Indicator : 1 Minute Scalping Strategy Crypto" strategy from "Fx MENTOR US" who doesn't make any official claims but given the indicators he was using, it looked like on the surface that this might actually work. The strategy author uses this on the 1 minute and 3 minute timeframes on mostly FOREX and Heiken Ashi candles but as the title of his strategy indicates is designed for Crypto. So who knows..
To backtest this accurately and get a better picture we resolved the Heiken Ashi bars to standard candlesticks . Even so, I was unable to sustain any consistency in my results on either the 1 or 3 min time frames and both FOREX and Crypto. 10000% Busted.
This strategy uses a combination of 3 open-source public indicators:
Trend Magic by KivancOzbilgic
Squeeze Momentum by LazyBear
Cumulative Delta Volume by LonesomeTheBlue
Trend Magic consists of two main indicators to validate momentum and volatility. It uses an ATR like a trailing Stop to determine the overarching momentum and CCI as a means to validate volatility. Together these are used as the primary indicator in this strategy. When the CCI is above 0 this is confirmation of a volatility event is occurring with affirmation based upon current momentum (ATR).
The CCI volatility indicator gets confirmation by the the Cumulative Delta Volume indicator which calculates the difference between buying and selling pressure. Volume Delta is calculated by taking the difference of the volume that traded at the offer price and the volume that traded at the bid price. The more volume that is traded at the bid price, the more likely there is momentum in the market.
And lastly the Squeeze Momentum indicator which uses a combination of Bollinger Bands, Keltner Channels and Momentum are used to again confirm momentum and volatility. During periods of low volatility, Bollinger bands narrow and trade inside Keltner channels. They can only contract so much before it can’t contain the energy it’s been building. When the Bollinger bands come back out, it explodes higher. When we see the histogram bar exploding into green above 0 that is a clear confirmation of increased momentum and volatile. The opposite (red) below 0 is true when there are low periods. This indicator is used as a means to really determine when there is premium selling plays going on leading to big directional movements again confirming the positive or negative momentum and volatility direction.
If you know of or have a strategy you want to see myth-busted or just have an idea for one, please feel free to message me.
Trading Rules
1 - 3 min candles
FOREX or Crypto
Stop loss at swing high/low | 1.5 risk/ratio
Long Condition
Trend Magic line is Blue ( CCI is above 0) and above the current close on the bar
Squeeze Momentum's histogram bar is green/lime
Cumulative Delta Volume line is green
Short Condition
Trend Magic line is Red ( CCI is below 0) and below the current close on the bar
Squeeze Momentum's histogram bar is red/maroon
Cumulative Delta Volume line is peach

Сatching knivesThis strategy is based on the regression line and volume
The Linear Regression Channel is a three-line technical indicator that displays the high, low and midpoint of the current trend.
How does it work in strategy?
If there is a deviation by a given percentage, the entry occurs
//LOGIC ENTRY
-Length-сhannel length
-Deviation-deviation of the boundaries, the higher , the rarer the entries
-% low for regression-deviation directly from the boundaries, the higher the number, the less frequent the entries
-Required % down bar-additional condition for entry (the candle on which the entry takes place from the logic must necessarily fall by a given percentage)
-Volume-the volume, which must be larger by the number of times you specify ( you can set the volume lower, but for better entries, you need to set the deviation percentages higher!)
//EXIT SETTING
Take profit and stop loss when a certain percentage is reached
//SETTINGS NEXT ENTRY AND GRID
Allow signal lower than,% - the next entry into a trade from logic occurs only when a decrease by a certain percentage
Allow grid,% - when the price drops by the percentage specified in the settings, the entry will take place, but only on the next bar.
//DATA RANGE
-Testing results for any period of time
//
Default settings for infrequent but relatively accurate entries for TF 1 hour.
It costs pyramiding 5 and take profit 5%. Choose the flavors of your choice!
Good luck!

Pious 3/8 EMA High-Low + 89 EMA Strategybuy signal when 3emah cross above 8emah, 3emal cross above 8emal,high cross above previous 3 high with volume and vice versa

Zero Lag Trend Signals (MTF) [Quant Trading] V7Overview
The Zero Lag Trend Signals (MTF) V7 is a comprehensive trend-following strategy that combines Zero Lag Exponential Moving Average (ZLEMA) with volatility-based bands to identify high-probability trade entries and exits. This strategy is designed to reduce lag inherent in traditional moving averages while incorporating dynamic risk management through ATR-based stops and multiple exit mechanisms.
This is a longer term horizon strategy that takes limited trades. It is not a high frequency trading and therefore will also have limited data and not > 100 trades.
How It Works
Core Signal Generation:
The strategy uses a Zero Lag EMA (ZLEMA) calculated by applying an EMA to price data that has been adjusted for lag:
Calculate lag period: floor((length - 1) / 2)
Apply lag correction: src + (src - src )
Calculate ZLEMA: EMA of lag-corrected price
Volatility bands are created using the highest ATR over a lookback period multiplied by a band multiplier. These bands are added to and subtracted from the ZLEMA line to create upper and lower boundaries.
Trend Detection:
The strategy maintains a trend variable that switches between bullish (1) and bearish (-1):
Long Signal: Triggers when price crosses above ZLEMA + volatility band
Short Signal: Triggers when price crosses below ZLEMA - volatility band
Optional ZLEMA Trend Confirmation:
When enabled, this filter requires ZLEMA to show directional momentum before entry:
Bullish Confirmation: ZLEMA must increase for 4 consecutive bars
Bearish Confirmation: ZLEMA must decrease for 4 consecutive bars
This additional filter helps avoid false signals in choppy or ranging markets.
Risk Management Features:
The strategy includes multiple stop-loss and take-profit mechanisms:
Volatility-Based Stops: Default stop-loss is placed at ZLEMA ± volatility band
ATR-Based Stops: Dynamic stop-loss calculated as entry price ± (ATR × multiplier)
ATR Trailing Stop: Ratcheting stop-loss that follows price but never moves against position
Risk-Reward Profit Target: Take-profit level set as a multiple of stop distance
Break-Even Stop: Moves stop to entry price after reaching specified R:R ratio
Trend-Based Exit: Closes position when price crosses EMA in opposite direction
Performance Tracking:
The strategy includes optional features for monitoring and analyzing trades:
Floating Statistics Table: Displays key metrics including win rate, GOA (Gain on Account), net P&L, and max drawdown
Trade Log Labels: Shows entry/exit prices, P&L, bars held, and exit reason for each closed trade
CSV Export Fields: Outputs trade data for external analysis
Default Strategy Settings
Commission & Slippage:
Commission: 0.1% per trade
Slippage: 3 ticks
Initial Capital: $1,000
Position Size: 100% of equity per trade
Main Calculation Parameters:
Length: 70 (range: 70-7000) - Controls ZLEMA calculation period
Band Multiplier: 1.2 - Adjusts width of volatility bands
Entry Conditions (All Disabled by Default):
Use ZLEMA Trend Confirmation: OFF - Requires ZLEMA directional momentum
Re-Enter on Long Trend: OFF - Allows multiple entries during sustained trends
Short Trades:
Allow Short Trades: OFF - Strategy is long-only by default
Performance Settings (All Disabled by Default):
Use Profit Target: OFF
Profit Target Risk-Reward Ratio: 2.0 (when enabled)
Dynamic TP/SL (All Disabled by Default):
Use ATR-Based Stop-Loss & Take-Profit: OFF
ATR Length: 14
Stop-Loss ATR Multiplier: 1.5
Profit Target ATR Multiplier: 2.5
Use ATR Trailing Stop: OFF
Trailing Stop ATR Multiplier: 1.5
Use Break-Even Stop-Loss: OFF
Move SL to Break-Even After RR: 1.5
Use Trend-Based Take Profit: OFF
EMA Exit Length: 9
Trade Data Display (All Disabled by Default):
Show Floating Stats Table: OFF
Show Trade Log Labels: OFF
Enable CSV Export: OFF
Trade Label Vertical Offset: 0.5
Backtesting Date Range:
Start Date: January 1, 2018
End Date: December 31, 2069
Important Usage Notes
Default Configuration: The strategy operates in its most basic form with default settings - using only ZLEMA crossovers with volatility bands and volatility-based stop-losses. All advanced features must be manually enabled.
Stop-Loss Priority: If multiple stop-loss methods are enabled simultaneously, the strategy will use whichever condition is hit first. ATR-based stops override volatility-based stops when enabled.
Long-Only by Default: Short trading is disabled by default. Enable "Allow Short Trades" to trade both directions.
Performance Monitoring: Enable the floating stats table and trade log labels to visualize strategy performance during backtesting.
Exit Mechanisms: The strategy can exit trades through multiple methods: stop-loss hit, take-profit reached, trend reversal, or trailing stop activation. The trade log identifies which exit method was used.
Re-Entry Logic: When "Re-Enter on Long Trend" is enabled with ZLEMA trend confirmation, the strategy can take multiple long positions during extended uptrends as long as all entry conditions remain valid.
Capital Efficiency: Default setting uses 100% of equity per trade. Adjust "default_qty_value" to manage position sizing based on risk tolerance.
Realistic Backtesting: Strategy includes commission (0.1%) and slippage (3 ticks) to provide realistic performance expectations. These values should be adjusted based on your broker and market conditions.
Recommended Use Cases
Trending Markets: Best suited for markets with clear directional moves where trend-following strategies excel
Medium to Long-Term Trading: The default length of 70 makes this strategy more appropriate for swing trading rather than scalping
Risk-Conscious Traders: Multiple stop-loss options allow traders to customize risk management to their comfort level
Backtesting & Optimization: Comprehensive performance tracking features make this strategy ideal for testing different parameter combinations
Limitations & Considerations
Like all trend-following strategies, performance may suffer in choppy or ranging markets
Default 100% position sizing means full capital exposure per trade - consider reducing for conservative risk management
Higher length values (70+) reduce signal frequency but may improve signal quality
Multiple simultaneous risk management features may create conflicting exit signals
Past performance shown in backtests does not guarantee future results
Customization Tips
For more aggressive trading:
Reduce length parameter (minimum 70)
Decrease band multiplier for tighter bands
Enable short trades
Use lower profit target R:R ratios
For more conservative trading:
Increase length parameter
Enable ZLEMA trend confirmation
Use wider ATR stop-loss multipliers
Enable break-even stop-loss
Reduce position size from 100% default
For optimal choppy market performance:
Enable ZLEMA trend confirmation
Increase band multiplier
Use tighter profit targets
Avoid re-entry on trend continuation
Visual Elements
The strategy plots several elements on the chart:
ZLEMA line (color-coded by trend direction)
Upper and lower volatility bands
Long entry markers (green triangles)
Short entry markers (red triangles, when enabled)
Stop-loss levels (when positions are open)
Take-profit levels (when enabled and positions are open)
Trailing stop lines (when enabled and positions are open)
Optional ZLEMA trend markers (triangles at highs/lows)
Optional trade log labels showing complete trade information
Exit Reason Codes (for CSV Export)
When CSV export is enabled, exit reasons are coded as:
0 = Manual/Other
1 = Trailing Stop-Loss
2 = Profit Target
3 = ATR Stop-Loss
4 = Trend Change
Conclusion
Zero Lag Trend Signals V7 provides a robust framework for trend-following with extensive customization options. The strategy balances simplicity in its core logic with sophisticated risk management features, making it suitable for both beginner and advanced traders. By reducing moving average lag while incorporating volatility-based signals, it aims to capture trends earlier while managing risk through multiple configurable exit mechanisms.
The modular design allows traders to start with basic trend-following and progressively add complexity through ZLEMA confirmation, multiple stop-loss methods, and advanced exit strategies. Comprehensive performance tracking and export capabilities make this strategy an excellent tool for systematic testing and optimization.
Note: This strategy is provided for educational and backtesting purposes. All trading involves risk. Past performance does not guarantee future results. Always test thoroughly with paper trading before risking real capital, and adjust position sizing and risk parameters according to your risk tolerance and account size.
================================================================================
TAGS:
================================================================================
trend following, ZLEMA, zero lag, volatility bands, ATR stops, risk management, swing trading, momentum, trend confirmation, backtesting
================================================================================
CATEGORY:
================================================================================
Strategies
================================================================================
CHART SETUP RECOMMENDATIONS:
================================================================================
For optimal visualization when publishing:
Use a clean chart with no other indicators overlaid
Select a timeframe that shows multiple trade signals (4H or Daily recommended)
Choose a trending asset (crypto, forex major pairs, or trending stocks work well)
Show at least 6-12 months of data to demonstrate strategy across different market conditions
Enable the floating stats table to display key performance metrics
Ensure all indicator lines (ZLEMA, bands, stops) are clearly visible
Use the default chart type (candlesticks) - avoid Heikin Ashi, Renko, etc.
Make sure symbol information and timeframe are clearly visible
================================================================================
COMPLIANCE NOTES:
================================================================================
✅ Open-source publication with complete code visibility
✅ English-only title and description
✅ Detailed explanation of methodology and calculations
✅ Realistic commission (0.1%) and slippage (3 ticks) included
✅ All default parameters clearly documented
✅ Performance limitations and risks disclosed
✅ No unrealistic claims about performance
✅ No guaranteed results promised
✅ Appropriate for public library (original trend-following implementation with ZLEMA)
✅ Educational disclaimers included
✅ All features explained in detail
================================================================================

VWAP Retest + EMA9 Cross + Candle Pattern V2📈 VWAP Retest + EMA9 Cross + Candle Pattern Strategy_V2
Setup: This intraday momentum strategy combines 3 core elements:
• VWAP Retest: Price retests VWAP within a small buffer zone
• EMA9 Crossover: EMA9 crosses above VWAP within the last 3 bars
• Bullish Candle Pattern: At least one bullish signal — Hammer, Engulfing, or Momentum candle
A trade is triggered only during the US morning session (9:30–12:30 EST) and only if price is above yesterday’s high, suggesting strong momentum.
⚙️ Strategy Settings
• Initial Capital: $100,000
• Position Sizing: 10% of equity per trade
• Commission: 0.03% per trade
• Slippage: 1 tick
• Take Profit: +3% from entry
• Stop Loss: 0.5% below VWAP at entry
• Forced Exit: 1:00 PM EST
📊 Strategy Logic
• VWAP Retest Filter ensures entry is near a value zone.
• EMA9 Cross Confirmation aligns short-term momentum with volume-weighted price.
• Bullish Candle Patterns provide price action confirmation:
○ ✅ Hammer
○ ✅ Bullish Engulfing
○ ✅ Large momentum body
• Above Yesterday’s High (YH) acts as a bullish bias filter.
🧪 Backtest Results (Jan 2023 – Oct 2025)
• Total Trades: 120
• Win Rate: 52.5%
• Profit Factor: 1.18
• Max Drawdown: 1.22%
• Net P&L: +$1,064 (+1.06%)
Due to chart data limits, only part of the period may be visible on publication charts.
🔍 Chart Visuals
This strategy plots:
• VWAP (white) and EMA9 (orange)
• Candle pattern markers:
○ “H” = Hammer
○ “BE” = Bullish Engulfing
○ “M” = Momentum Candle
• “SETUP” label when all conditions are met
• YH/YL labels for context — previous day’s high/low
💡 Use Case
This setup is designed for intraday momentum scalping, ideal for traders who:
• Trade morning breakouts
• Use VWAP as a dynamic support/resistance
• Want clear, rule-based entries based on both trend and price action
Educational and research use - not financial advice.

Order Block Volumatic FVG StrategyInspired by: Volumatic Fair Value Gaps —
License: CC BY-NC-SA 4.0 (Creative Commons Attribution–NonCommercial–ShareAlike).
This script is a non-commercial derivative work that credits the original author and keeps the same license.
What this strategy does
This turns BigBeluga’s visual FVG concept into an entry/exit strategy. It scans bullish and bearish FVG boxes, measures how deep price has mitigated into a box (as a percentage), and opens a long/short when your mitigation threshold and filters are satisfied. Risk is managed with a fixed Stop Loss % and a Trailing Stop that activates only after a user-defined profit trigger.
Additions vs. the original indicator
✅ Strategy entries based on % mitigation into FVGs (long/short).
✅ Lower-TF volume split using upticks/downticks; fallback if LTF data is missing (distributes prior bar volume by close’s position in its H–L range) to avoid NaN/0.
✅ Per-FVG total volume filter (min/max) so you can skip weak boxes.
✅ Age filter (min bars since the FVG was created) to avoid fresh/immature boxes.
✅ Bull% / Bear% share filter (the 46%/53% numbers you see inside each FVG).
✅ Optional candle confirmation and cooldown between trades.
✅ Risk management: fixed SL % + Trailing Stop with a profit trigger (doesn’t trail until your trigger is reached).
✅ Pine v6 safety: no unsupported args, no indexof/clamp/when, reverse-index deletes, guards against zero/NaN.
How a trade is decided (logic overview)
Detect FVGs (same rules as the original visual logic).
For each FVG currently intersected by the bar, compute:
Mitigation % (how deep price has entered the box).
Bull%/Bear% split (internal volume share).
Total volume (printed on the box) from LTF aggregation or fallback.
Age (bars) since the box was created.
Apply your filters:
Mitigation ≥ Long/Short threshold.
Volume between your min and max (if enabled).
Age ≥ min bars (if enabled).
Bull% / Bear% within your limits (if enabled).
(Optional) the current candle must be in trade direction (confirm).
If multiple FVGs qualify on the same bar, the strategy uses the most recent one.
Enter long/short (no pyramiding).
Exit with:
Fixed Stop Loss %, and
Trailing Stop that only starts after price reaches your profit trigger %.
Input settings (quick guide)
Mitigation source: close or high/low. Use high/low for intrabar touches; close is stricter.
Mitigation % thresholds: minimal mitigation for Long and Short.
TOTAL Volume filter: skip FVGs with too little/too much total volume (per box).
Bull/Bear share filter: require, e.g., Long only if Bull% ≥ 50; avoid Short when Bull% is high (Short Bull% max).
Age filter (bars): e.g., ≥ 20–30 bars to avoid fresh boxes.
Confirm candle: require candle direction to match the trade.
Cooldown (bars): minimum bars between entries.
Risk:
Stop Loss % (fixed from entry price).
Activate trailing at +% profit (the trigger).
Trailing distance % (the trailing gap once active).
Lower-TF aggregation:
Auto: TF/Divisor → picks 1/3/5m automatically.
Fixed: choose 1/3/5/15m explicitly.
If LTF can’t be fetched, fallback allocates prior bar’s volume by its close position in the bar’s H–L.
Suggested starting presets (you should optimize per market)
Mitigation: 60–80% for both Long/Short.
Bull/Bear share:
Long: Bull% ≥ 50–70, Bear% ≤ 100.
Short: Bull% ≤ 60 (avoid shorting into strong support), Bear% ≥ 0–70 as you prefer.
Age: ≥ 20–30 bars.
Volume: pick a min that filters noise for your symbol/timeframe.
Risk: SL 4–6%, trailing trigger 1–2%, distance 1–2% (crypto example).
Set slippage/fees in Strategy Properties.
Notes, limitations & best practices
Data differences: The LTF split uses request.security_lower_tf. If the exchange/data feed has sparse LTF data, the fallback kicks in (it’s deliberate to avoid NaNs but is a heuristic).
Real-time vs backtest: The current bar can update until close; results on historical bars use closed data. Use “Bar Replay” to understand intrabar effects.
No pyramiding: Only one position at a time. Modify pyramiding in the header if you need scaling.
Assets: For spot/crypto, TradingView “volume” is exchange volume; in some markets it may be tick volume—interpret filters accordingly.
Risk disclosure: Past performance ≠ future results. Use appropriate position sizing and risk controls; this is not financial advice.
Credits
Visual FVG concept and original implementation: BigBeluga.
This derivative strategy adds entry/exit logic, volume/age/share filters, robust LTF handling, and risk management while preserving the original spirit.
License remains CC BY-NC-SA 4.0 (non-commercial, attribution required, share-alike).

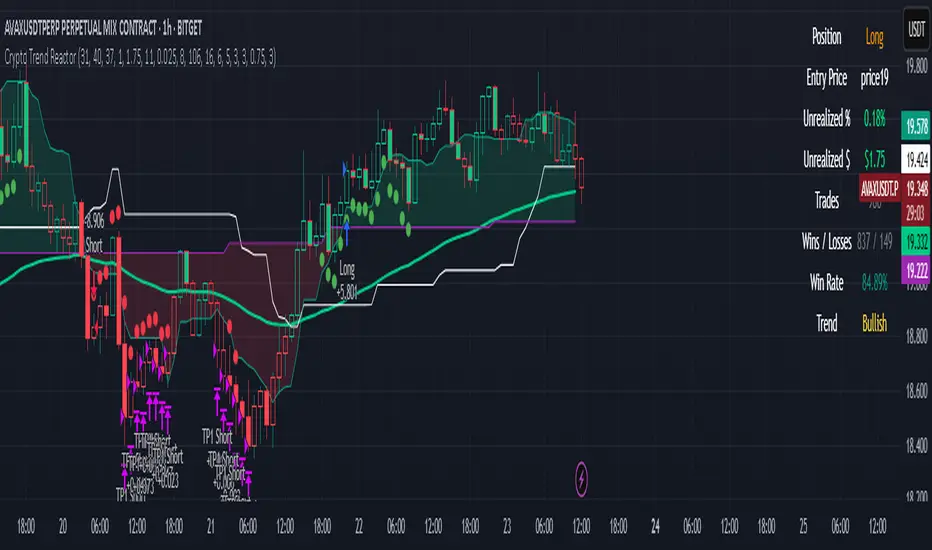
Crypto Trend Reactor
Crypto Trend Reactor
🔧 By Rob Groff
Crypto Trend Reactor is a precision-engineered crypto trading strategy designed to identify high-quality trades through a fusion of advanced non-repainting indicators. This system integrates adaptive trend detection, volatility compression analysis, and directional momentum confirmation to provide clear, rule-based entries and dynamic trade management.
📜 Disclaimer
This script is for informational and educational purposes only. It is not financial advice or a recommendation to buy or sell any financial instrument. Always conduct your own research and consult with a professional advisor before making trading decisions.
✅ System Overview
This strategy is built around a synergy of robust, market-tested indicators that function together to filter noise, enhance trend clarity, and improve execution timing.
✅ McGinley Dynamic (Baseline)
An adaptive moving average that adjusts to price velocity, offering smoother and more responsive trend detection than traditional EMAs. Used to establish the primary trend direction.
✅ TTM Squeeze + Momentum
Detects volatility compression using Bollinger Bands inside Keltner Channels. When momentum aligns with a squeeze release, it signals explosive breakout potential — perfect for crypto markets.
✅ Vortex Indicator (Directional Volatility Filter)
Measures positive and negative trend strength. It confirms whether momentum aligns with trend direction, reducing false signals and choppy conditions.
✅ White Line (Bias Filter)
A simplified market structure average (High/Low midpoint) that acts as a bias filter. Aligning entries with this structural midpoint ensures trades are taken in the path of least resistance.
✅ Tether Line Cloud (Support/Resistance Mapping)
Fast and slow tether lines form a dynamic support/resistance cloud. This visual reference confirms price structure and trend shifts in real-time.
✅ ATR-Based Dynamic Stop Loss
Trailing stops adapt to volatility using ATR (with wick consideration). This enables better protection against random spikes while giving trades room to breathe.
✅ Fixed Multi-Level Take Profits (TP1 & TP2)
Position-reducing take profit levels help secure gains while maintaining trade flexibility. After TP2 is hit, the strategy supports dynamic re-entry if the trend resumes.
✅ Advanced Features
✅ Fully non-repainting logic
✅ Dynamic re-entry support after TP2 or stop-out
✅ Separate take profit and stop loss logic for long and short trades
✅ Visual trade dashboard with live PnL, win rate, position info, and trend status
✅ TTM Squeeze dots shown as ✅ blue dots below/above bars
✅ Bar coloring and cloud fills based on real-time trend alignment
✅ Built-in date filter for backtest range control
✅ Recommended Use
Timeframe: Best optimized for the 1-hour chart, but effective on other timeframes with minor tuning
Market: Designed for crypto, but also functional in other volatile asset classes
Strategy Mode: Works best in trending environments. Avoids ranging conditions via Vortex filtering and multi-confirmation layers
✅ Best Practices
✅ Confirm entries only when all filters align (trend, bias, volatility, and momentum)
✅ Monitor the dashboard for live trade metrics and trend health
✅ Use the built-in stop and TP logic to automate exits
✅ Backtest with various parameter settings to fine-tune for specific coins or volatility profiles
This script represents the fusion of structure, momentum, trend, and volatility — delivering an edge-driven approach for serious crypto traders seeking consistent execution and high-probability setups.
Trend Hunter Scalping [Daddin Algo]Trend Hunter Scalping Strategy Description
This strategy is a comprehensive scalping system designed to capture high-frequency trading opportunities within short timeframes. It combines multiple technical indicators to assess trend direction, momentum, volatility, and volume dynamics. Importantly, all parameters are user-adjustable, allowing the strategy to be optimized for various market conditions and individual preferences.
Technical Indicators and Settings
EMA (Exponential Moving Average):
The EMA is calculated based on a user-defined period. Rather than being fixed (e.g., a 200-period EMA), the period is adjustable to suit different market conditions. The position of the price relative to the EMA helps confirm the overall trend.
RSI & RSIOver:
The Relative Strength Index (RSI) measures momentum and the speed of price changes. Entry signals are generated when the RSI crosses its moving average. Additionally, overbought and oversold thresholds (set by the user) add an extra layer of confirmation for the signals.
ADX:
The Average Directional Index (ADX) assesses the strength of the current trend. When the ADX is above a user-specified threshold, the signals are considered more reliable. This helps in filtering out signals during weak trending periods.
Bollinger Bands:
Bollinger Bands gauge market volatility. The settings—including the length and the multiplier—are adjustable, providing flexibility to accommodate tightening or expanding volatility conditions.
Parabolic SAR:
This indicator identifies dynamic support and resistance levels, confirming the trend direction and helping pinpoint potential entry and exit points.
Pivot Levels (Fibonacci):
Calculated from the previous period's high, low, and close, pivot points and Fibonacci levels indicate potential reversal points and serve as support and resistance levels. These levels provide context for setting trailing stops and managing risk.
Volume Filter:
A volume condition ensures that trading signals are only considered valid when the current volume exceeds a multiple of its short-term moving average. This filter is adjustable, helping to confirm the strength of the market move.
Daddin Line:
Derived from a short-term moving average of the closing prices with a user-defined offset, the Daddin Line acts as an additional confirmation tool. Its parameters can be customized to better align with specific trading environments.
Trading Logic and Management
Signal Direction and Entry:
The strategy can generate both long (buy) and short (sell) signals, or be limited to one direction based on user preference. Entry orders are executed when all the selected indicator conditions are met. Additionally, maximum consecutive trade limits are implemented to help control risk.
Exit & Take Profit:
Trades are exited automatically when a user-defined profit percentage is reached. This take-profit percentage is flexible, enabling adjustments to match different market conditions or trading goals.
Trailing Stop (Dynamic Stop Loss):
A trailing stop mechanism is implemented using Fibonacci pivot levels. Once a position is open, the stop loss is dynamically updated as the price moves favorably. This ensures that profits are protected while minimizing losses in case of a sudden reversal.
Additional Features and Backtesting
Time Filtering (Backtesting):
The strategy includes a date range filter for backtesting. Users can define the start and end dates to evaluate the strategy’s performance during specific market periods, making it easier to assess its historical effectiveness.
Customizable Parameters:
Every indicator and risk management setting is fully customizable. This adaptability allows traders to tailor the strategy to different assets, timeframes, and market environments, ensuring optimal performance across diverse trading scenarios.
Conclusion
The Trend Hunter Scalping strategy effectively integrates multiple technical indicators to validate trends and manage risks efficiently. Its highly flexible, user-adjustable parameters make it adaptable to varying market conditions, providing traders with a robust framework for capturing quick trading opportunities.This strategy is designed to optimize both entry and exit points while offering comprehensive risk management controls.

TSI Long/Short for BTC 2HThe TSI Long/Short for BTC 2H strategy is an advanced trend-following system designed specifically for trading Bitcoin (BTC) on a 2-hour timeframe. It leverages the True Strength Index (TSI) to identify momentum shifts and executes both long and short trades in response to dynamic market conditions.
Unlike traditional moving average-based strategies, this script uses a double-smoothed momentum calculation, enhancing signal accuracy and reducing noise. It incorporates automated position sizing, customizable leverage, and real-time performance tracking, ensuring a structured and adaptable trading approach.
🔹 What Makes This Strategy Unique?
Unlike simple crossover strategies or generic trend-following approaches, this system utilizes a customized True Strength Index (TSI) methodology that dynamically adjusts to market conditions.
🔸 True Strength Index (TSI) Filtering – The script refines the TSI by applying double exponential smoothing, filtering out weak signals and capturing high-confidence momentum shifts.
🔸 Adaptive Entry & Exit Logic – Instead of fixed thresholds, it compares the TSI value against a dynamically determined high/low range from the past 100 bars to confirm trade signals.
🔸 Leverage & Risk Optimization – Position sizing is dynamically adjusted based on account equity and leverage settings, ensuring controlled risk exposure.
🔸 Performance Monitoring System – A built-in performance tracking table allows traders to evaluate monthly and yearly results directly on the chart.
📊 Core Strategy Components
1️⃣ Momentum-Based Trade Execution
The strategy generates long and short trade signals based on the following conditions:
✅ Long Entry Condition – A buy signal is triggered when the TSI crosses above its 100-bar highest value (previously set), confirming bullish momentum.
✅ Short Entry Condition – A sell signal is generated when the TSI crosses below its 100-bar lowest value (previously set), indicating bearish pressure.
Each trade execution is fully automated, reducing emotional decision-making and improving trading discipline.
2️⃣ Position Sizing & Leverage Control
Risk management is a key focus of this strategy:
🔹 Dynamic Position Sizing – The script calculates position size based on:
Account Equity – Ensuring trade sizes adjust dynamically with capital fluctuations.
Leverage Multiplier – Allows traders to customize risk exposure via an adjustable leverage setting.
🔹 No Fixed Stop-Loss – The strategy relies on reversals to exit trades, meaning each position is closed when the opposite signal appears.
This design ensures maximum capital efficiency while adapting to market conditions in real time.
3️⃣ Performance Visualization & Tracking
Understanding historical performance is crucial for refining strategies. The script includes:
📌 Real-Time Trade Markers – Buy and sell signals are visually displayed on the chart for easy reference.
📌 Performance Metrics Table – Tracks monthly and yearly returns in percentage form, helping traders assess profitability over time.
📌 Trade History Visualization – Completed trades are displayed with color-coded boxes (green for long trades, red for short trades), visually representing profit/loss dynamics.
📢 Why Use This Strategy?
✔ Advanced Momentum Detection – Uses a double-smoothed TSI for more accurate trend signals.
✔ Fully Automated Trading – Removes emotional bias and enforces discipline.
✔ Customizable Risk Management – Adjust leverage and position sizing to suit your risk profile.
✔ Comprehensive Performance Tracking – Integrated reporting system provides clear insights into past trades.
This strategy is ideal for Bitcoin traders looking for a structured, high-probability system that adapts to both bullish and bearish trends on the 2-hour timeframe.
📌 How to Use: Simply add the script to your 2H BTC chart, configure your leverage settings, and let the system handle trade execution and tracking! 🚀

Williams %R StrategyThe Williams %R Strategy implemented in Pine Script™ is a trading system based on the Williams %R momentum oscillator. The Williams %R indicator, developed by Larry Williams in 1973, is designed to identify overbought and oversold conditions in a market, helping traders time their entries and exits effectively (Williams, 1979). This particular strategy aims to capitalize on short-term price reversals in the S&P 500 (SPY) by identifying extreme values in the Williams %R indicator and using them as trading signals.
Strategy Rules:
Entry Signal:
A long position is entered when the Williams %R value falls below -90, indicating an oversold condition. This threshold suggests that the market may be near a short-term bottom, and prices are likely to reverse or rebound in the short term (Murphy, 1999).
Exit Signal:
The long position is exited when:
The current close price is higher than the previous day’s high, or
The Williams %R indicator rises above -30, indicating that the market is no longer oversold and may be approaching an overbought condition (Wilder, 1978).
Technical Analysis and Rationale:
The Williams %R is a momentum oscillator that measures the level of the close relative to the high-low range over a specific period, providing insight into whether an asset is trading near its highs or lows. The indicator values range from -100 (most oversold) to 0 (most overbought). When the value falls below -90, it indicates an oversold condition where a reversal is likely (Achelis, 2000). This strategy uses this oversold threshold as a signal to initiate long positions, betting on mean reversion—an established principle in financial markets where prices tend to revert to their historical averages (Jegadeesh & Titman, 1993).
Optimization and Performance:
The strategy allows for an adjustable lookback period (between 2 and 25 days) to determine the range used in the Williams %R calculation. Empirical tests show that shorter lookback periods (e.g., 2 days) yield the most favorable outcomes, with profit factors exceeding 2. This finding aligns with studies suggesting that shorter timeframes can effectively capture short-term momentum reversals (Fama, 1970; Jegadeesh & Titman, 1993).
Scientific Context:
Mean Reversion Theory: The strategy’s core relies on mean reversion, which suggests that prices fluctuate around a mean or average value. Research shows that such strategies, particularly those using oscillators like Williams %R, can exploit these temporary deviations (Poterba & Summers, 1988).
Behavioral Finance: The overbought and oversold conditions identified by Williams %R align with psychological factors influencing trading behavior, such as herding and panic selling, which often create opportunities for price reversals (Shiller, 2003).
Conclusion:
This Williams %R-based strategy utilizes a well-established momentum oscillator to time entries and exits in the S&P 500. By targeting extreme oversold conditions and exiting when these conditions revert or exceed historical ranges, the strategy aims to capture short-term gains. Scientific evidence supports the effectiveness of short-term mean reversion strategies, particularly when using indicators sensitive to momentum shifts.
References:
Achelis, S. B. (2000). Technical Analysis from A to Z. McGraw Hill.
Fama, E. F. (1970). Efficient Capital Markets: A Review of Theory and Empirical Work. The Journal of Finance, 25(2), 383-417.
Jegadeesh, N., & Titman, S. (1993). Returns to Buying Winners and Selling Losers: Implications for Stock Market Efficiency. The Journal of Finance, 48(1), 65-91.
Murphy, J. J. (1999). Technical Analysis of the Financial Markets: A Comprehensive Guide to Trading Methods and Applications. New York Institute of Finance.
Poterba, J. M., & Summers, L. H. (1988). Mean Reversion in Stock Prices: Evidence and Implications. Journal of Financial Economics, 22(1), 27-59.
Shiller, R. J. (2003). From Efficient Markets Theory to Behavioral Finance. Journal of Economic Perspectives, 17(1), 83-104.
Williams, L. (1979). How I Made One Million Dollars… Last Year… Trading Commodities. Windsor Books.
Wilder, J. W. (1978). New Concepts in Technical Trading Systems. Trend Research.
This explanation provides a scientific and evidence-based perspective on the Williams %R trading strategy, aligning it with fundamental principles in technical analysis and behavioral finance.

Zero-lag TEMA Crosses Strategy[Pakun]Here's the adjusted strategy description in English, aligned with the house rules:
---
### Strategy Name: Zero-lag TEMA Cross Strategy
**Purpose:** This strategy aims to identify entry and exit points in the market using Zero-lag Triple Exponential Moving Averages (TEMA). It focuses on minimizing lag and improving the accuracy of trend-following signals.
### Uniqueness and Usefulness
**Uniqueness:** This strategy employs the less commonly used Zero-lag TEMA, compared to standard moving averages. This unique approach reduces lag and provides more timely signals.
**Usefulness:** This strategy is valuable for traders looking to capture trend reversals or continuations with reduced lag. It has the potential to enhance the profitability and accuracy of trades.
### Entry Conditions
**Long Entry:**
- **Condition:** A crossover occurs where the short-term Zero-lag TEMA surpasses the long-term Zero-lag TEMA.
- **Signal:** A buy signal is generated, indicating a potential uptrend.
**Short Entry:**
- **Condition:** A crossunder occurs where the short-term Zero-lag TEMA falls below the long-term Zero-lag TEMA.
- **Signal:** A sell signal is generated, indicating a potential downtrend.
### Exit Conditions
**Exit Strategy:**
- **Stop Loss:** Positions are closed if the price moves against the trade and hits the predefined stop loss level. The stop loss is set based on recent highs/lows.
- **Take Profit:** Positions are closed when the price reaches the profit target. The profit target is calculated as 1.5 times the distance between the entry price and the stop loss level.
### Risk Management
**Risk Management Rules:**
- This strategy incorporates a dynamic stop loss mechanism based on recent highs/lows over a specified period.
- The take profit level ensures a reward-to-risk ratio of 1.5 times the stop loss distance.
- These measures aim to manage risk and protect capital.
**Account Size:** ¥500,000
**Commissions and Slippage:** 94 pips per trade and 1 pip slippage
**Risk per Trade:** 1% of account equity
### Configurable Options
**Configurable Options:**
- Lookback Period: The number of bars to calculate recent highs/lows.
- Fast Period: Length of the short-term Zero-lag TEMA (69).
- Slow Period: Length of the long-term Zero-lag TEMA (130).
- Signal Display: Option to display buy/sell signals on the chart.
- Bar Color: Option to change bar colors based on trend direction.
### Adequate Sample Size
**Sample Size Justification:**
- To ensure the robustness and reliability of the strategy, it should be tested with a sufficiently long period of historical data.
- It is recommended to backtest across multiple market cycles to adapt to different market conditions.
- This strategy was backtested using 10 days of historical data, including 184 trades.
### Notes
**Additional Considerations:**
- This strategy is designed for educational purposes and should be thoroughly tested in a demo environment before live trading.
- Settings should be adjusted based on the asset being traded and current market conditions.
### Credits
**Acknowledgments:**
- The concept and implementation of Zero-lag TEMA are based on contributions from technical analysts and the trading community.
- Special thanks to John Doe for the TEMA concept.
- Thanks to Zero-lag TEMA Crosses .
- This strategy has been enhanced by adding new filtering algorithms and risk management rules to the original TEMA code.
### Clean Chart Description
**Chart Appearance:**
- This strategy provides a clean and informative chart by plotting Zero-lag TEMA lines and optional entry/exit signals.
- The display of signals and color bars can be toggled to declutter the chart, improving readability and analysis.

Pullback_Power [JackTz]Welcome to Pullback_Power
Pullback_Power is a scalping strategy designed to capitalize on market retracements while incorporating unique dynamic features to enhance profitability.
Calculation
Pullback_Power purely uses moving averages to calculate both entry and exits. Exits can also be set to fixed percentages for both take profit and stop loss.
How the Strategy Works
Statistics show that markets normally do a recovery after each drop. Crypto markets can easily drop up to 20% within a few hours and then do a complete or partial recovery. Pullback_Power utilizes this known pattern alongside pyramiding. The strategy aims to catch one or more entries when the price drops, hoping to make profits when the market recovers from the drop. The fixed take profit and stop loss can be used to define your risk management, while the dynamic exit opportunity is riskier but provides the ability to stay in the trade longer while it recovers. Pullback_Power can make up to four entries. This means it utilizes pyramiding to spread out the entry points, but every exit is a full exit. It is not possible to partially exit.
Utility
Pullback_Power is a scalping strategy suitable for traders who operate with small trades and don't want to stay in the market for too long. Pullback_Power offers precise signals with no repainting. The strategy thrives in volatility, so crypto pairs might yield the best results, although this strategy can be adapted to work on all pairs and markets.
How to Automate It
Pullback_Power utilizes the standard placeholders of strategies on TradingView. This enables the trader to add every data point into a webhook, making it fully flexible to suit every trader's needs. To automate, create an alert, set the webhook URL, and add the JSON body needed for the webhook. An example of a simple JSON webhook with some of the standard strategy placeholders:
{
"side": "{{strategy.order.action}}",
"symbol": "{{ticker}}",
"amount": "{{strategy.order.contracts}}"
}
Read about all the standard placeholders that you can use here: TradingView - Standard strategy placeholders
Originality
Pullback_Power is unique in its ability to create precise signals without repainting while maintaining a solid approach to the pullback strategy. Its simplicity not only makes the strategy easy to use and understand but also highly effective. The simplicity reduces inputs, eliminating overfitting and limits each input to avoid incorrect usage. Many times, default settings are enough to achieve good backtesting results on almost all pairs available. Pullback_Power also differs from many other strategies by its solid code, which enhances performance and provides more reliable backtesting. The clean code increases the resilience and precision of the entries, making it less prone to errors.
Many pullback/scalping strategies normally only works on specific scopes of timeframes or pairs. Pullback_Power can easily be adapted to work on almost every scenario. The biggest change needed is the length of the moving average. The lower the timeframe, the higher a length is needed for proper results. I.e. on a 2H timeframe a length of 3 can yield good results. On a 5min timeframe the length might need to be as high as 70.
How to Use
To use Pullback_Power, add the script to your trading chart. By default, Pullback_Power opens four orders to optimize trade opportunities with a default fee value set at 0.1%. You can change these default settings in the Settings window under the Properties tab. To tailor Pullback_Power to your individual trading style, navigate to the Settings under the Input tab. Here you can configure various inputs to fit your trading style.
- Backtest settings , Start Date:
Defines the date of when the calculation starts. Use this to set the date of when the first trade could potentially emit.
- Backtest settings , End Date:
Defines the date of when the calculation ends. If there are any open trades after this date the close calculations are still live. It only makes sure that new orders cannot be opened after this date.
- Backtest settings , Only trade on weekdays:
This is a toggle you can enable or disable. If enabled it only allows new entries to happen during the normal week days, meaning Monday, Tuesday, Wednesday, Thursday and Friday.
Disable this to enable the script to open trades on all 7 days of the week.
- Open settings , Use dynamic long positions:
This toggle allows you to enable or disable the pullback level calculations after first trade.
If enabled, the calculations of level 2, 3 and 4 continues to happen after each bar, making the levels follow the price with the moving averages calculations.
If disabled, the calculations of the levels stop after the first trade. This means that the levels calculation at the point of the first trade stay fixed until all trades are closed.
You can see the difference of the green lines on the chart when you toggle this flag.
- Open settings , Data type:
This is the bar data used for the moving average calculation when opening trades. The possible data types are Open, High, Low, Close, HL2, HLC3, OHLC4, OC2 and HC2.
- Open settings , Source type:
This is the source used to calculate the moving average. The types available are: SMA, PCMA, EMA, WMA, DEMA, ZLEMA and HMA.
- Open settings , Length:
This is the length used for the moving average calculations. 3 means it takes the last 3 bars of historical data for the calculation.
- Open settings , Offset:
This defines if the calculation should use an offset for the historical data. This does not use a look-forward feature, but a look-backward feature. To prevent any possible repaints the offset can only be positive, not negative.
For instance, if the length is 3 and the offset is 0 the calculation is made from the last 3 bars, making it bar1, bar2 and bar3. If the length is 3 and the offset is 1 the calculation is made from bar2, bar3, and bar4 – offsetting the calculation by 1 bar.
- Leverage settings , Leverage liquidation (1-125):
The script itself does not handle any custom leverage calculation – this must be done in the Properties tabs and increasing the order size.
This setting is made to test a possible liquidation event if using leverage.
By setting this to higher than 1, a red line is visible after the first trade on the chart. This indicates the liquidation price.
If this setting is set to 25, the script will calculate the liquidation price from a x25 leverage. If this price is hit, the scripts stops emitting any orders and the background turns red.
You can use this to test if your settings could handle a certain level of leverage.
- Pullback settings , Pullback 1, 2, 3 and 4:
Each of these settings defines the entry price of each pullback level. If Pullback 1 is set to -6 it means that the moving average calculation should be 6% lower than the actual price.
The same logic applies to Pullback 2, 3 and 4.
Setting any level to 0 will disable the level – eliminating any orders to emit on that level.
This can be used to change the level of pyramiding down from 4 if needed.
If you do this, remember to also change the order size and the pyramiding value in the Properties tab accordingly.
- Close settings , Use dynamic TP and SL:
If enabled, script will exit all orders using the same but separate algorithm for moving averages. This enables the user to define if you want the orders to be closed if the price level of this moving average is hit. The price level for this calculation is visible on the chart by the blue line.
Although you can change the length and offset, as described underneath, this calculation uses the same data and source type defined in the Open settings area.
- Close settings , Length, Close:
This is the length used for the closing moving average calculations. 3 means it takes the last 3 bars of historical data for the calculation.
- Close settings , Offset, Close:
This defines if the calculation for the closing moving average should use an offset for the historical data. Just as the offset used for opening order, this does not use a look-forward feature, but a look-backward feature. To prevent any possible repaints the offset can only be positive, not negative.
For instance, if the length is 3 and the offset is 0 the calculation is made from the last 3 bars, making it bar1, bar2 and bar3. If the length is 3 and the offset is 1 the calculation is made from bar2, bar3, and bar4 – offsetting the calculation by 1 bar.
- Close settings , Use TakeProfit:
This toggle enables/disables a fixed take profit percentage.
- Close settings , TP %:
This sets the wanted % to reach on a take profit. This setting is ignored if the toggle above is disabled.
- Close settings , Use StopLoss:
This toggle enables/disables a fixed stop loss percentage.
- Close settings , SL %:
This sets the wanted % to reach on a stop loss. This setting is ignored if the toggle above is disabled.
Exit on Same Bar as Entry
By default, the script doesn't emit any exit orders on the same bar as the first entry order. Enable "Recalculation: After order is filled" to change this behavior.
Troubleshooting
While Pullback_Power is designed to provide reliable trading signals, you may encounter rare issues. One such issue could be receiving an error message stating "can't open orders with 0 or negative qty." If you encounter this error, it is likely due to specific conditions on the selected timeframe. To resolve this issue, change the timeframe on your trading chart.
Underlying Principles and Value Proposition
Pullback_Power leverages moving averages and volatility behavior to identify market retracements and capitalize on them. The strategy is rooted in the understanding that markets often experience temporary reversals or "pullbacks" before resuming their primary trend. By identifying these pullbacks and entering trades at opportune moments, Pullback_Power aims to capture quick profits from short-term market movements.
The dynamic and fixed calculations of Take Profit (TP) and Stop Loss (SL) levels enhances risk management, ensuring that potential losses are controlled while allowing room for profits to grow. The adaptive approach using the moving averages considers current market conditions, making the strategy flexible and responsive to changing volatility.
Moreover, Pullback_Power's non-repainting nature ensures the reliability of its signals, eliminating hindsight bias and providing traders with actionable insights based on real-time market data.
The strategy's simplicity and effectiveness make it accessible for traders of all experience levels. Whether you're a beginner looking to start scalping or an experienced trader seeking to diversify your trading approach, Pullback_Power offers a balanced blend of simplicity and sophistication to help you navigate the markets with confidence.
By focusing on clear, transparent principles and offering practical tools for risk management, Pullback_Power aims to provide tangible value to traders, empowering them to make informed decisions and optimize their trading outcomes.
Thank you for choosing Pullback_Power. I wish you successful trading!

Bitfinex Shorts StratOverview
This strat applies the data from BITFINEX:USDSHORTS to the RSI indicator in order to provide SHORT/LONG entries as the number of contracts goes up and down. Although Bitfinex has lost relevance over the years its generally considered an exchange dominated by smart money rather than retail. I'd like to see if any insights can be gained by following their trading behaviour.
How to use
Select the underlying security you wish to trade and load the indicator. Select the appropriate short security by searching in the Bitfinex Short Symbol. RSI settings apply to short symbol not the actual asset. Strategy shorts the underlying asset when shorts rise and longs when they drop. The shorts symbol will follow the value of the loaded chart. Works best on 4 hour chart.
Why use shorts only rather than both long/shorts?
Bitfinex longs seem to be on a long-term uptrend accounting for 25x the number of shorts. Might be enormous confidence on part of the whales, but more likely reflects selling spot and buying perp. Given the size disparity and price action I don't think longs info is adding much.
Problems with script:
a) We don't really know the intentions of short players (e.g. speculation or hedging spot)
b) The script uses a decline in shorts as a long signal
c) RSI is a blunt tool there are probably better options for calculating high/lows in shorts
d) Shorts are accumulated both at highs and also when BTC price is already heavily trending down. This suggests some are speculative (at the highs) or protective/hedging during a decline
Takeaways:
Based on this strat Bitfinex whales are more wrong than right.
Results don't carry across well into altcoins using the accompanying short symbol. However, what is interesting is that applying the BITFINEX:BTCUSDSHORTS to altcoin charts does work pretty well.
Strat needs some refinement to control for entries under different circumstances.
Probably not a great idea to use this as a strategy in isolation, but highlights how Bitfinex whale behaviour is a good gauge to follow.

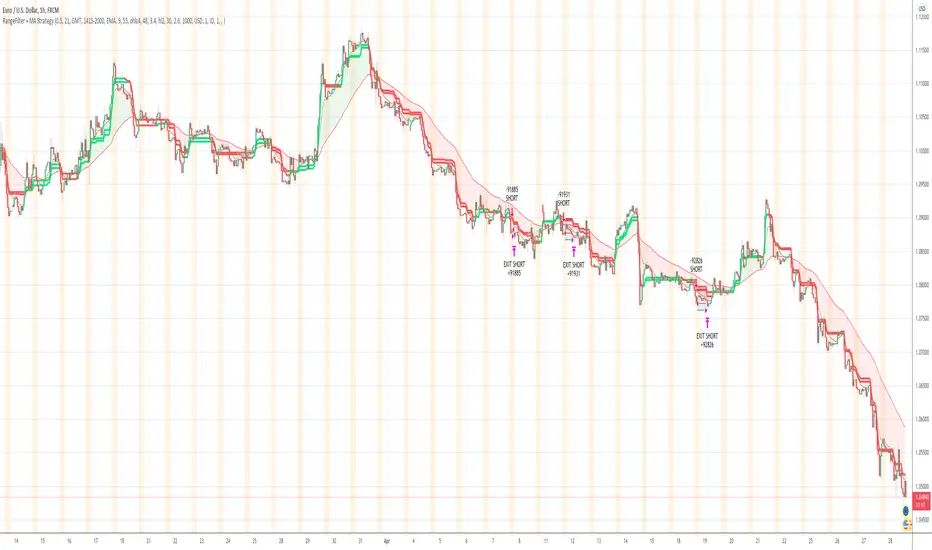
Range Filter + MA Strategy [Kintsugi Trading]What is the Range Filter + MA Strategy?
This premium indicator was inspired by my desire to find and place high probability forex trades in any market, direction, or time of day.
Why Forex?
The Forex markets operate 24 hours, 5.5 days a week
Access to meaningful leverage
Ability to easily trade long or short
High liquidity
How to use it!
----- First, start by choosing a Risk/Reward Ratio and Stop PIP Size. -----
- Risk/Reward Ratio = If you have a .5 risk/reward, it means you are risking $100 to make $50.
- Stop PIP Size = How many PIPs will be representative of the max risk. i.e. - if you are risking $100 and you set the PIP stop to 10, that means 10 PIPs = $100.
----- Next, we set the Session Filter. -----
Set the Timezone and Trade Session you desire. If no specific session is desired, simply leave the box unchecked.
----- Next, we set the Moving Average Cloud. -----
Enter the Moving Average Type:
Simple Moving Average
Exponential Moving Average
Hull Moving Average
Weighted Moving Average
Smoothed Moving Average
Enter the fast and slow Moving Average Period.
These inputs will determine whether the strategy looks for Long or Short positions.
----- Next, we set the Range Filters. -----
In combination with the Moving Average Cloud, the Range Filter will help us determine when to take a trade and in what direction.
The strategy is essentially looking for small reversals going against the overall trend and placing a trade once that reversal ends and the price moves back in the direction of the overall trend.
The Range filter utilizes confirmation between two entirely separate Range Filter calculations (or set them both equal to use one).
Each Range Filter is completely customizable by:
Source Calculation (open, high, low, close, hl2, hlc3, ohlc4, hlcc4)
Sampling Period
Range Multiplier
----- Finally, we backtest our ideas. -----
After using the 'Strategy Tester' tab on TradingView to thoroughly backtest your predictions you are ready to take it to the next level - Automated Trading!
This was my whole reason for creating the script. If you work a full-time job, live in a time zone that is hard to trade, or just don't have the patience, this will be a game-changer for you as it was for me.
Auto-Trading
When it comes to auto-trading this strategy I have included two options in the script that utilize the alert messages generated by TradingView.
*Note: Please trade on a demo account until you feel comfortable enough to use real money, and then please stick to 1%-2% of your total account value in risk per trade.*
AutoView
PineConnector
Good luck with your trading!
Combo Backtest 123 Reversal & High - EMA Strategy This is combo strategies for get a cumulative signal.
First strategy
This System was created from the Book "How I Tripled My Money In The
Futures Market" by Ulf Jensen, Page 183. This is reverse type of strategies.
The strategy buys at market, if close price is higher than the previous close
during 2 days and the meaning of 9-days Stochastic Slow Oscillator is lower than 50.
The strategy sells at market, if close price is lower than the previous close price
during 2 days and the meaning of 9-days Stochastic Fast Oscillator is higher than 50.
Second strategy
This indicator plots the difference between the High (of the previous period)
and an exponential moving average (13 period) of the Close (of the previous period).
You can use in the xPrice any series: Open, High, Low, Close, HL2, HLC3, OHLC4 and ect...
It buy if indicator above 0 and sell if below.
WARNING:
- For purpose educate only
- This script to change bars colors.
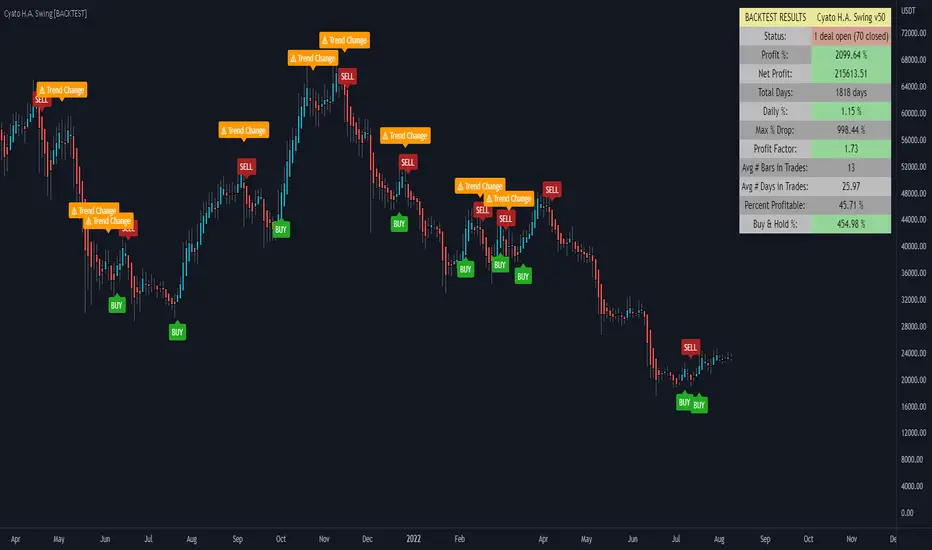
Cyatophilum H.A. Swing [BACKTEST]Hi guys, to celebrate the beginning of a new altcoins cycle, I created a Swing trade Indicator. (It's a joke, there will not be any altcoins cycle)
Cyatophilum Heikin Ashi Swing
This indicator will allow us to create one strategy for each pair and never miss those big swings ever again!
HOW BEAT BUY & HOLD WORKS
This kind of strategy is a safe long term investment , usually played in high timeframes such as 4H, 1D etc.
It is perfect for beginners in trading as the process is very simple: buy and sell when you receive the alert. The high timeframes allows to trade manually by receiving alerts on your phone or email, but you also can automate it if you prefer.
The primary goal of these strategies is to increase your capital faster than someone simply holding the asset .
The trades are made with no leverage and 100% equity . It is for those who want to grow their portfolio fast without risking to lose everything. You can use several strategies at once, in this case split your equity accordingly.
HOW DOES IT WORK?
The Heikin Ashi candles are very usefull. This strategy is built upon H.A. candles but is used on normal candles, because H.A. candles price are an average of real candles and we want to know the real price. I did the trick by recalculating the H.A. open, high, low and close with the original formula based on the real candles's ohlc. This allows me to use the strategy tester and backtest with real results.
HOW TO USE
Creating a signal is as simple as adding the indicator called to your chart and click "Set alert". Select "Once per bar close" for your alert options.
There are 3 alerts:
- BUY
- SELL
- BUY OR SELL (for free TV users)
Sample Backtest results
Bitcoin/Dollar
Ethereum/Bitcoin
Basic Attention Token/Bitcoin
> > Start using the indicator now < <
Note: This version is the BACKTEST. You can find the Alert version in my profile scripts.
High - EMA Strategy Backtest This indicator plots the difference between the High (of the previous period)
and an exponential moving average (13 period) of the Close (of the previous period).
You can use in the xPrice any series: Open, High, Low, Close, HL2, HLC3, OHLC4 and ect...
It buy if indicator above 0 and sell if below.
You can change long to short in the Input Settings
Please, use it only for learning or paper trading. Do not for real trading.

GraalSTRATEGY DESCRIPTION — “GRAAL”
GRAAL is an advanced algorithmic crypto-trading strategy designed for trend and semi-trend market conditions. It combines ATR-based trend/flat detection, dynamic Stop-Loss and multi-level Take-Profit, break-even (BE) logic, an optional trailing stop, and a “lock-on-trend” mechanism to hold positions until the market structure truly reverses.
The strategy is optimized for Binance, OKX and Bybit (USDT-M and USDC-M futures), but can also be used on spot as an indicator.
Core Logic
Trend Detection — dynamic trend zones built using ATR and local high/low structure.
Entry Logic — positions are opened only after trend confirmation and a momentum-based local trigger.
Exit Logic:
fixed TP levels (TP1/TP2/TP3),
dynamic ATR-based SL,
break-even move after TP1 or TP2,
optional trailing stop.
Lock-on-Trend — positions remain open until an opposite trend signal appears.
Noise Protection — flat filter disables entries during low-volatility conditions.
Key Advantages
Sophisticated and reliable risk-management system.
Minimal false entries due to robust trend filtering.
Optional trailing logic to maximize profit during strong directional moves.
Works well on BTC, ETH and major altcoins.
Easily adaptable for various timeframes (1m–4h).
Supports full automation via OKX / WunderTrading / 3Commas JSON alerts.
Recommended Use Cases
Crypto futures (USDT-M / USDC-M).
Intraday trading (5m–15m–1h).
Swing trading (4h–1D).
Fully automated signal-bot execution.
Important Notes
This is an algorithmic strategy, not financial advice.
Strategy Tester performance may differ from real execution due to liquidity, slippage and fees.
Always backtest and optimize parameters for your specific market and asset.
Recommended Settings: LONG only, no TP, no SL, Flat Policy: Hold, TP3 Mode: Trend, Trailing Stop 1.2%, Fixed size 100 USD, Leverage 10×, ATR=14, HH/LL=36.
